Welcome to the Power Users community on Codidact!
Power Users is a Q&A site for questions about the usage of computer software and hardware. We are still a small site and would like to grow, so please consider joining our community. We are looking forward to your questions and answers; they are the building blocks of a repository of knowledge we are building together.
How to add vertical line in the middle of two marks on image
Have
This .png image of a plot:
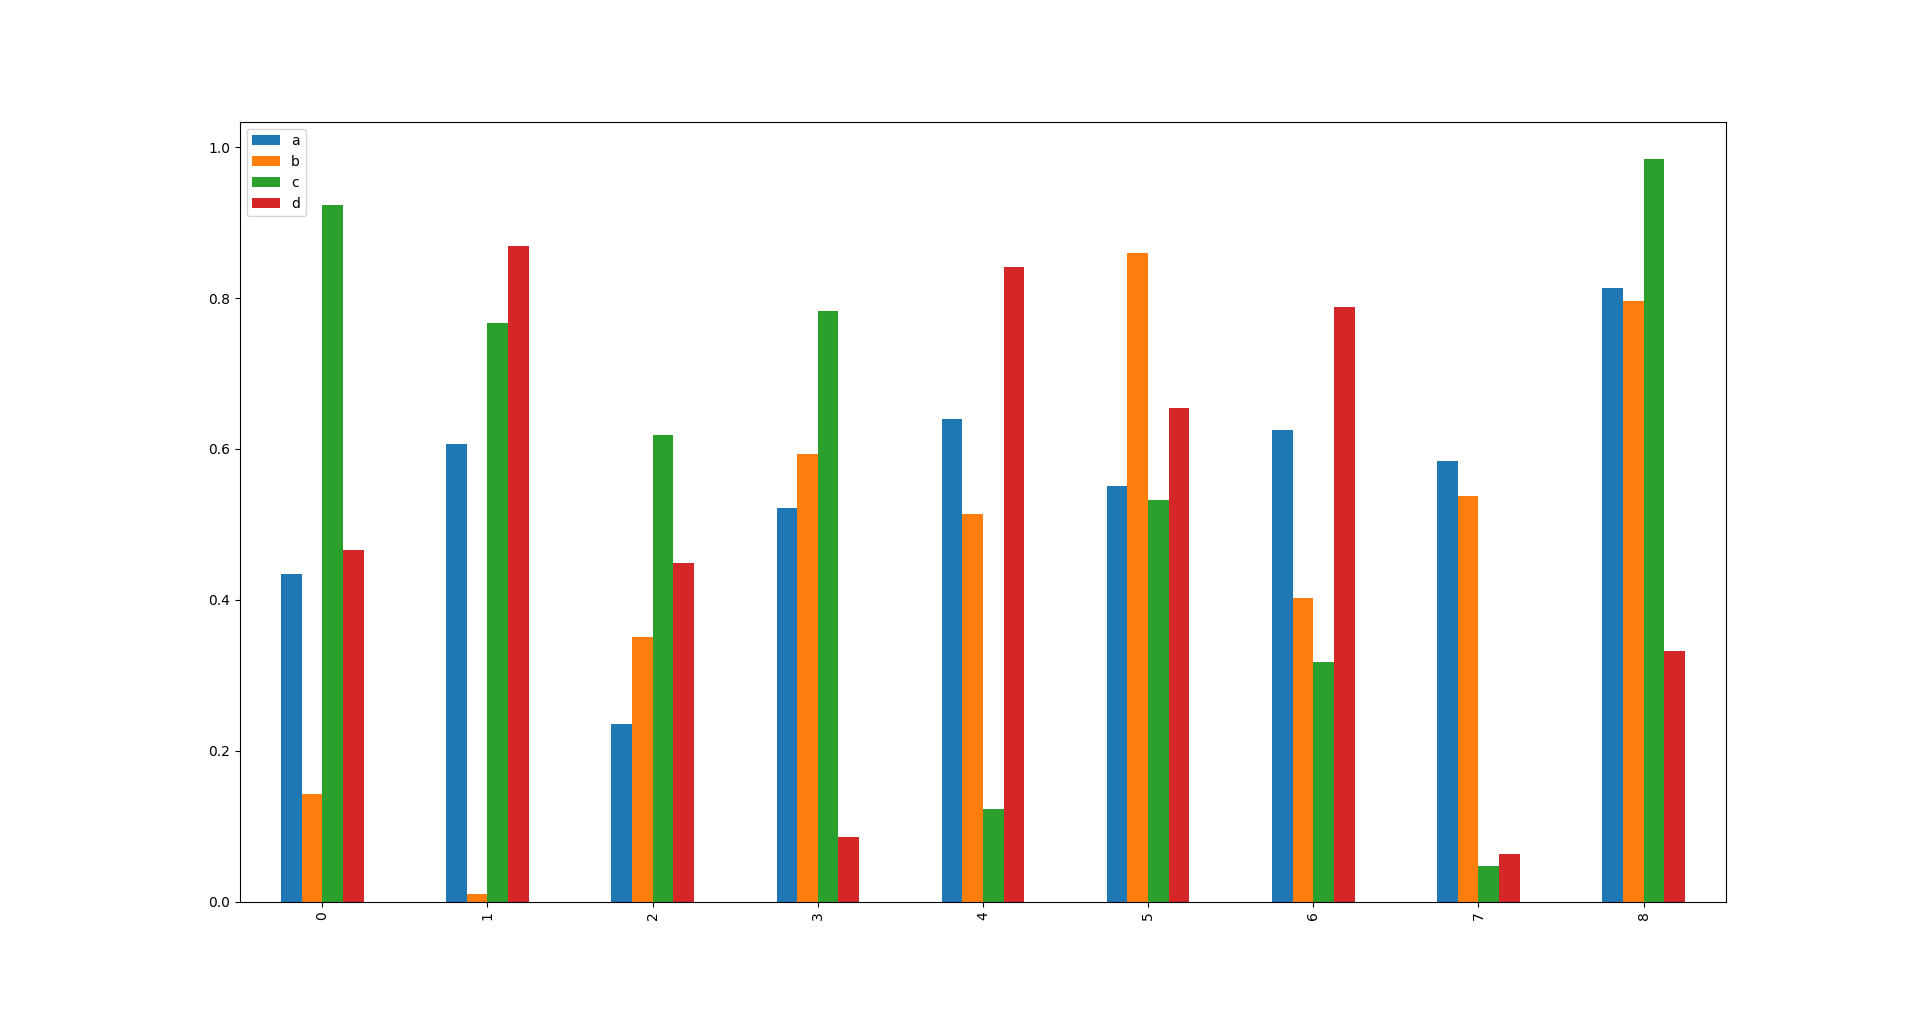
Want
To add vertcal lines between the groupings:
(0, 1, 2) LINE (3, 4, 5) LINE (6, 7, 8)
I want to place the lines exactly in the middle of the grouping boundaries.
The solution I envision is marking (*) the vertical edges of the bars of each
grouping boundary, and then placing a line exactly between those two
marks:
(0, 1, 2)* LINE *(3, 4, 5)...
Notes
I am using Linux, and have access to Gimp. That being said, I am open to better suited software other than Gimp, as long as it's available for Linux.
Inspired by this post.
1 answer
If you have access to the source of the image, fix the code instead of messing with the image. This will be much more accurate and result in a higher quality result.
You could add the lines via latex (texlive is available via the usual linux package managers, but is often already installed because many other tools have it as dependency).
-
first determined the coordinates of the
0and8x ticks (the commented green help lines in the example below). I'm using these coordinates instead of trying to determine the location of the bars, because these span a larger interval and thus the error from doing this by eye will be smaller. In the example below, they are at-16.1and17.45. -
next calculate from these coordinates the location of your desired lines,
-5.6158and6.9653.
(might be a bit overkill, but I think this will ensure that the lines are placed as precisely as possible)
\documentclass{standalone}
\usepackage{tikz}

\begin{document}

\begin{tikzpicture}[inner sep=0pt,outer sep=0pt]
\node at (0,0) {\includegraphics{ULaNwNrkXuSqPYiKGbEjrzGa}};
%\draw[green,line width=5pt] (-16.1,-10.1) -- ++(0,19.9);
%\draw[green,line width=5pt] (17.45,-10.1) -- ++(0,19.9);

\draw[magenta,line width=5pt] (-5.6158,-10.1) -- ++(0,19.9);
\draw[magenta,line width=5pt] (6.9653,-10.1) -- ++(0,19.9);
\end{tikzpicture}

\end{document}
(replace ULaNwNrkXuSqPYiKGbEjrzGa with the filename of your image)

1 comment thread

1 comment thread