Welcome to the Power Users community on Codidact!
Power Users is a Q&A site for questions about the usage of computer software and hardware. We are still a small site and would like to grow, so please consider joining our community. We are looking forward to your questions and answers; they are the building blocks of a repository of knowledge we are building together.
Post History
TL;DR Turns out the correct name is #pageAction-urlbar-metrication_deltamikecharlie { display: none !important; } Long version: How to find the name? There is actually a nice guide at ht...
#3: Post edited
by
 samcarter
·
2023-09-29T11:59:49Z (over 1 year ago)
samcarter
·
2023-09-29T11:59:49Z (over 1 year ago)
- ### TL;DR
- Turns out the correct name is
- ```
- #pageAction-urlbar-metrication_deltamikecharlie {
- display: none !important;
- }
- ```
- ### Long version:
- How to find the name?
- There is actually a nice guide at https://firefox-source-docs.mozilla.org/devtools-user/browser_toolbox/index.html
- To summarise:
- 1. open the web developer tools, click on the `...` at the top right and open the settings
- 2. under "Advanced settings", activate "Enable browser chrome and add-on debugging toolboxes" and "Enable remote debugging"
- 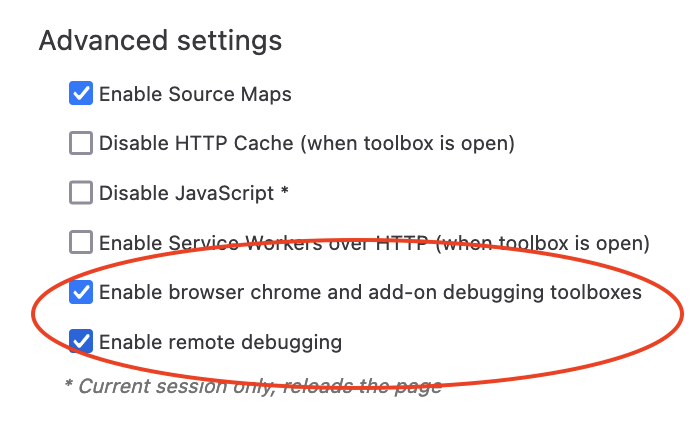
- 3. Use `Cmd+Opt+Shift+I` to open the browser toolbox
4. choose the element picker and select the UI element you are interested in and you'll be show the corresponding position in the html code to look up the name.
- ### TL;DR
- Turns out the correct name is
- ```
- #pageAction-urlbar-metrication_deltamikecharlie {
- display: none !important;
- }
- ```
- ### Long version:
- How to find the name?
- There is actually a nice guide at https://firefox-source-docs.mozilla.org/devtools-user/browser_toolbox/index.html
- To summarise:
- 1. open the web developer tools, click on the `...` at the top right and open the settings
- 2. under "Advanced settings", activate "Enable browser chrome and add-on debugging toolboxes" and "Enable remote debugging"
- 
- 3. Use `Cmd+Opt+Shift+I` to open the browser toolbox
- 4. choose the element picker and select the UI element you are interested in and you'll be show the corresponding position in the html code to look up the name.
- 5. Undo step 2 if you are finished
#2: Post edited
by
samcarter
·
2023-06-02T13:31:56Z (about 2 years ago)
- Turns out the correct name is
- ```
- #pageAction-urlbar-metrication_deltamikecharlie {
- display: none !important;
- }
- ```
---- How to find the name?
- There is actually a nice guide at https://firefox-source-docs.mozilla.org/devtools-user/browser_toolbox/index.html
- To summarise:
- 1. open the web developer tools, click on the `...` at the top right and open the settings
- 2. under "Advanced settings", activate "Enable browser chrome and add-on debugging toolboxes" and "Enable remote debugging"
- 
- 3. Use `Cmd+Opt+Shift+I` to open the browser toolbox
- 4. choose the element picker and select the UI element you are interested in and you'll be show the corresponding position in the html code to look up the name.
- ### TL;DR
- Turns out the correct name is
- ```
- #pageAction-urlbar-metrication_deltamikecharlie {
- display: none !important;
- }
- ```
- ### Long version:
- How to find the name?
- There is actually a nice guide at https://firefox-source-docs.mozilla.org/devtools-user/browser_toolbox/index.html
- To summarise:
- 1. open the web developer tools, click on the `...` at the top right and open the settings
- 2. under "Advanced settings", activate "Enable browser chrome and add-on debugging toolboxes" and "Enable remote debugging"
- 
- 3. Use `Cmd+Opt+Shift+I` to open the browser toolbox
- 4. choose the element picker and select the UI element you are interested in and you'll be show the corresponding position in the html code to look up the name.
#1: Initial revision
by
samcarter
·
2023-06-02T11:31:39Z (about 2 years ago)
Turns out the correct name is
```
#pageAction-urlbar-metrication_deltamikecharlie {
display: none !important;
}
```
---
How to find the name?
There is actually a nice guide at https://firefox-source-docs.mozilla.org/devtools-user/browser_toolbox/index.html
To summarise:
1. open the web developer tools, click on the `...` at the top right and open the settings
2. under "Advanced settings", activate "Enable browser chrome and add-on debugging toolboxes" and "Enable remote debugging"

3. Use `Cmd+Opt+Shift+I` to open the browser toolbox
4. choose the element picker and select the UI element you are interested in and you'll be show the corresponding position in the html code to look up the name.